Performance Measuring Tools
This page was originally created on and last edited on .
Introduction
There are many tools out there for measuring your website performance. Some of them are online tools where you can enter your website URL, some are browser tools or extensions, and some are standalone applications and tools. Best of all - a lot of them are free!
Online tools
WebPageTest
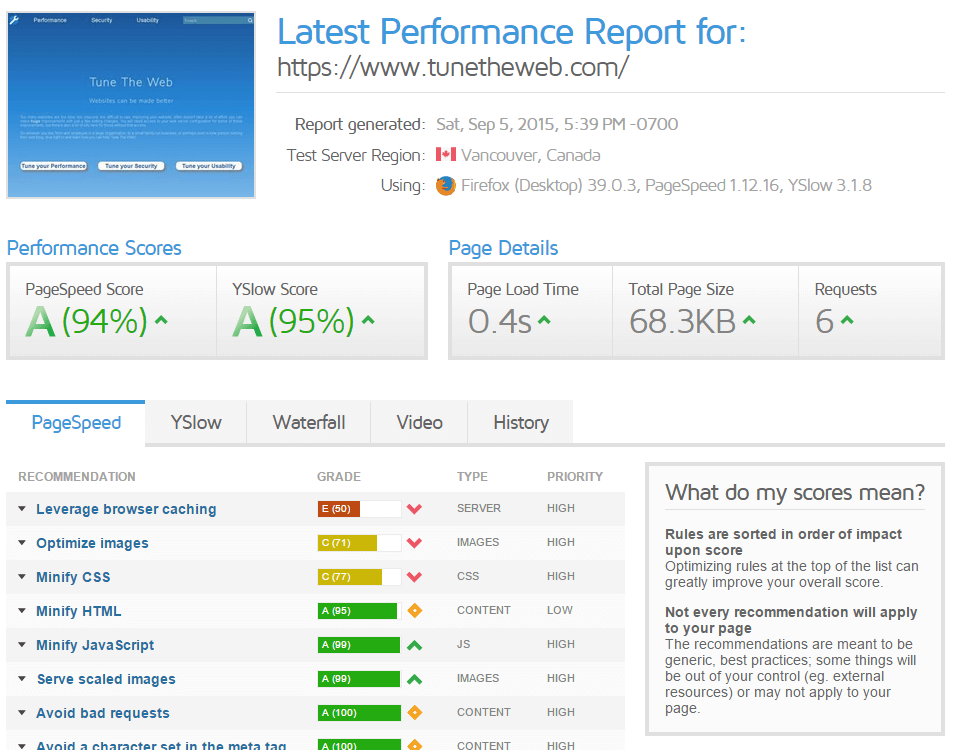
One of the most well known tools performance analysing website is www.webpagetest.com. Running the home page through this tool gives the following:
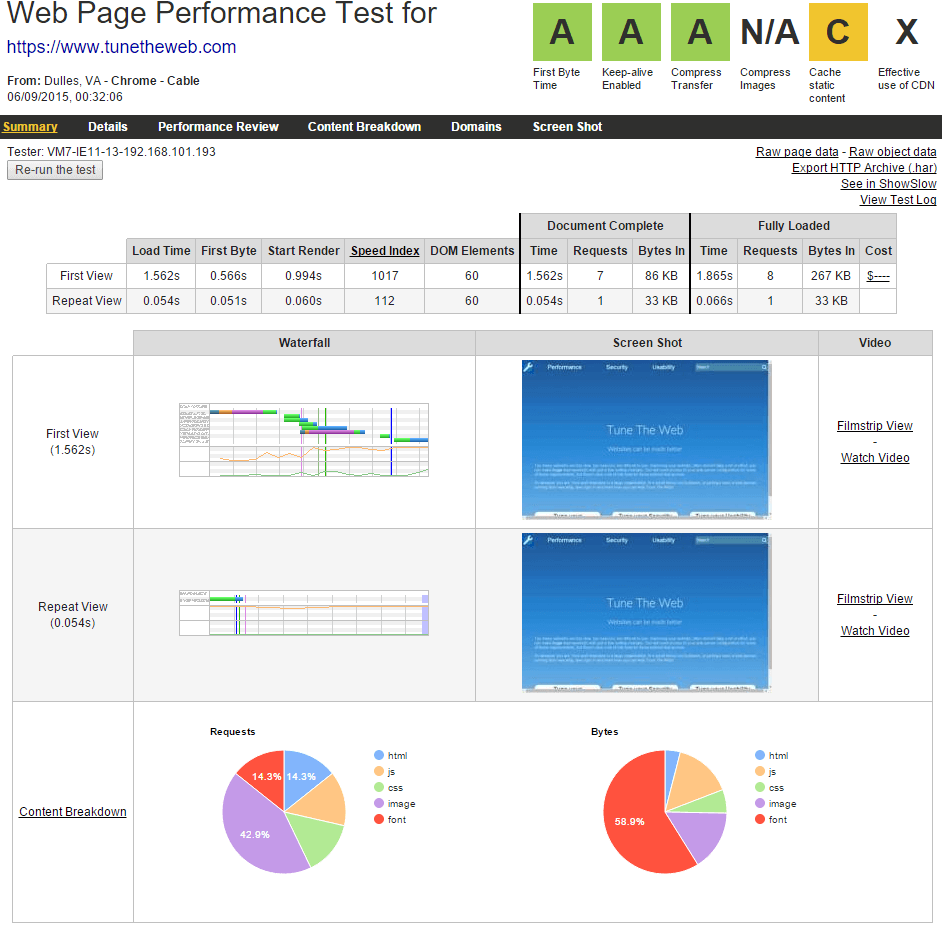
On the top right, are some grades: We have a nice green A for first byte time (which is mostly based on your network and server so thanks Amazon for that!), another green A because I have Keep-Alive enabled, another one for using gzip, I don't have any JPEG images so get an N/A for that, I only get a C grade for caching as I use a 3 hour expiry (which is deliberate) and I don't use a CDN so get an X for that. This is a nice summary of the main points you should check, and closely match the performance recommendations I give. You can click on each grade for more information.
Beneath that we have a table giving the high level summary of the two tests in this run. Two tests are run to allow you to see the impact of caching in the second test. So according to this table the page takes about 1.5 seconds to load. Of that the first half a second (0.556s) is used up waiting to get a response from the server, by the time nearly a second (0.994s) has passed the browser has enough information to start rendering the page. This gives a speed index score of 1017. There are 7 items and 86kb needed to show the page, and another item which brings it up to 267kb before the page is fully loaded. Our home page is actually pretty simple so these are all very good stats. General consensus is that web pages should load in under two seconds and ideally be less than a megabyte in size. The repeat view is even better as I have nice caching set up (despite the C grade above!) and the page starts displaying almost instantly (0.06s).
Beneath that table we have the details of each run. There is the Waterfall chart, a screenshot of wat it looks like, and the option to look at filmstrip and video of you page loading. The waterfall is most interesting and is definitely worth a closer look:
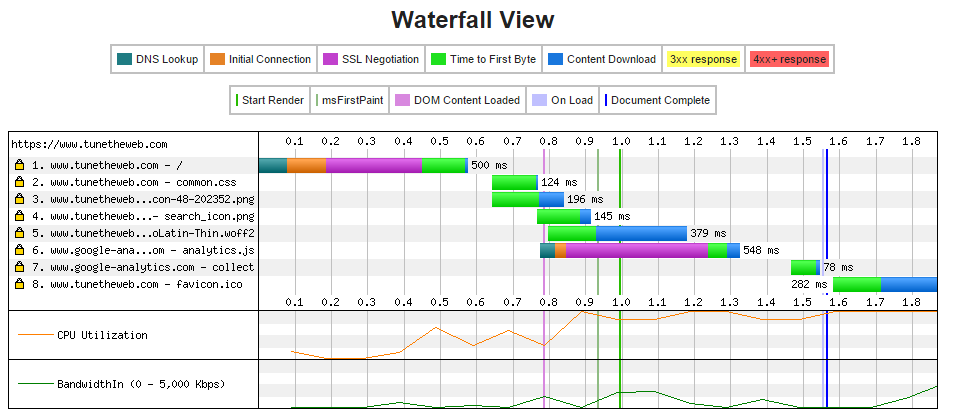
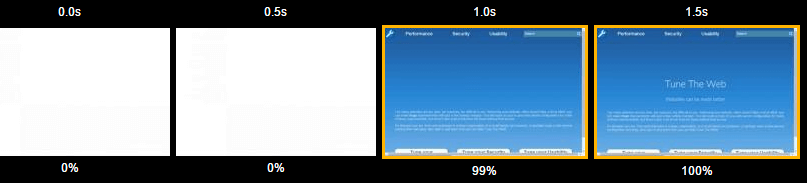
So here's where you can see exactly how your page is loaded and if anything's holding it up. The first request nearly 0.1 seconds to do the DNS Lookup to convert www.tunetheweb.com into an IP address, then another 0.1 seconds to connect (make sure you have Keep-Alive enabled so you don't see these for every connection), and then you see the performance impact of HTTPS as we get a 0.25 second hit while SSL Negotation is completed. It's important to Performance tune your HTTPS to keep this down to a minimum. Finally we can request the web page, and that take another 0.1 seconds and then to download the file is actually very quick as the HTML which makes up the home page is quite small as this is a simple site. The HTML is read, and the browser realises it needs a css file and the little wrench icon I use as the site logo, so these are requested in requests 2 and 3. Note that the browser has decided to get two requests in parallel, and that there are no DNS, Initial Connection or SSL Negotiation sections as that's all be done (providing your server is set up correctly). I'm not sure why it hasn't realised it needs the search icon, so that might be worth investigating. Once the CSS is loaded, we see we need a font, so we download that but in the meantime the browser has already started drawing the page. Looking at the filmstrip, you see this results in the page showing without the header (which is waiting for this font):
After this Google Analytics data is downloaded (and this does require a separate connection as it's to Google's servers so you see a DNS, Initial Connection and SSL Negotitation for that). Google Analytics is set up to load asynchronously which means it doesn't block the page load which is good as Google Analytics isn't really needed to display the page so why delay the users experience for that. Finally we load the favicon that displays in the browser tab and we're all done.
This page is pretty simple, and so that waterfall chart is pretty healthy looking. Your own web page may load a lot more assets and look a lot more complicated. You might also spot where resources are loaded in the wrong order (e.g. do you have a Javascript call in you head which is blocking all other items from loading?)
Understanding waterfall charts are key to understanding your performance and identifying opportunities for improvements. Moz have a very good guide to understanding waterfall diagrams which is well worth a read.
Google PageSpeed Insights
Google's PageSpeed Insights will run some tests and give performance suggestions, and divide these into Mobile and Desktop views (though mostly suggestions will be the same for both). Here's this websites's results:
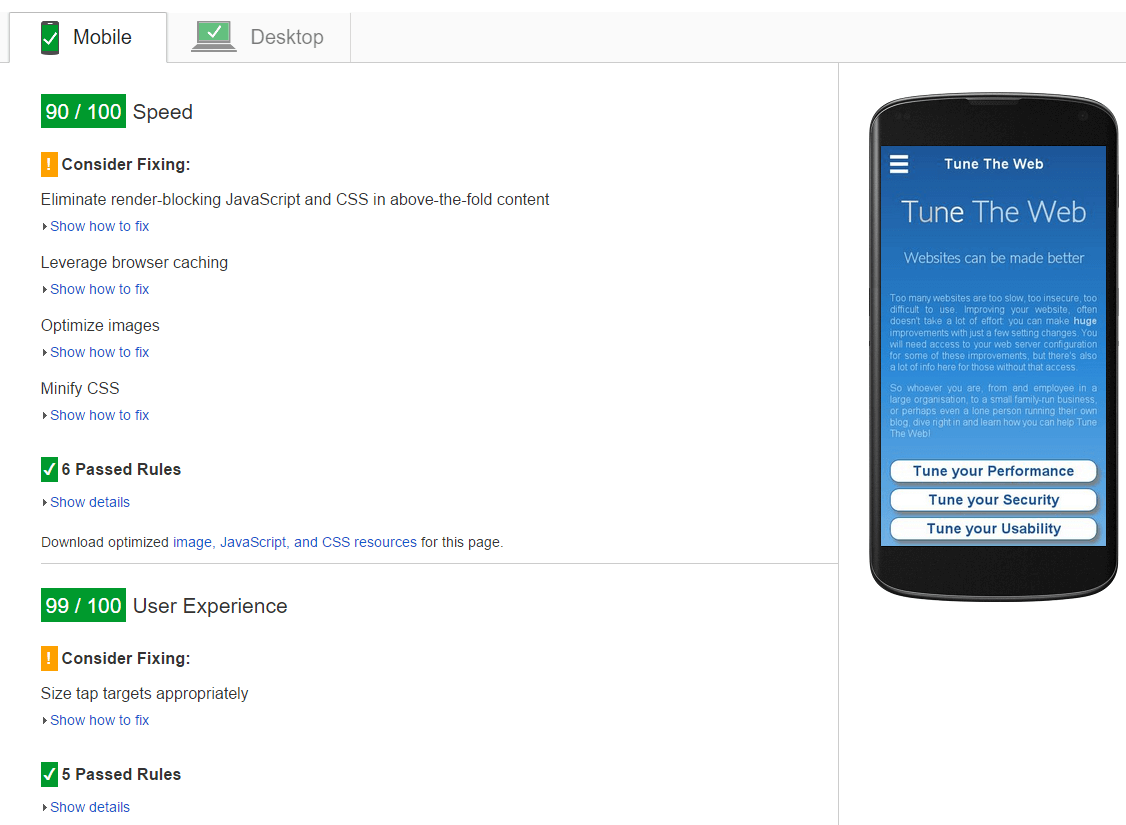
So I get pretty good scores for both speed and performance. For even better performance, they do suggest I inline my CSS (not for me!), improve caching (again not liking my 3 hour cache expiries!), squeeze down my images a bit more and minify my CSS. While these will undoubtedly improve performance I've chosen not to for various reasons, that I will explain at a later date.
GTmetrix
GTmetrix basically run two tools: above's PageSpeed Inights and YSlow, and give results of both, including suggestions for improvements. Results are shown below but I will not delve into them too much since they repeats most of the items discusses above:
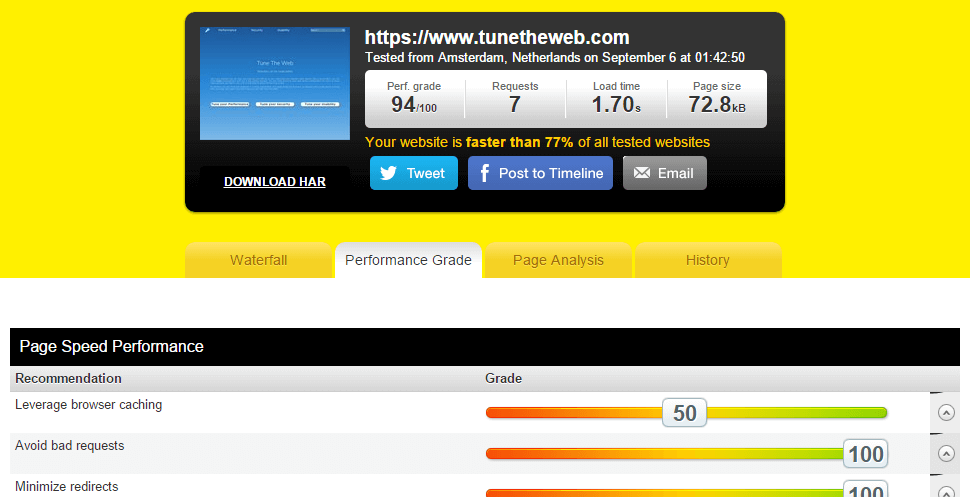
Pingdom
Pingdom have a free web test tool, which again gives various stats and suggestions:
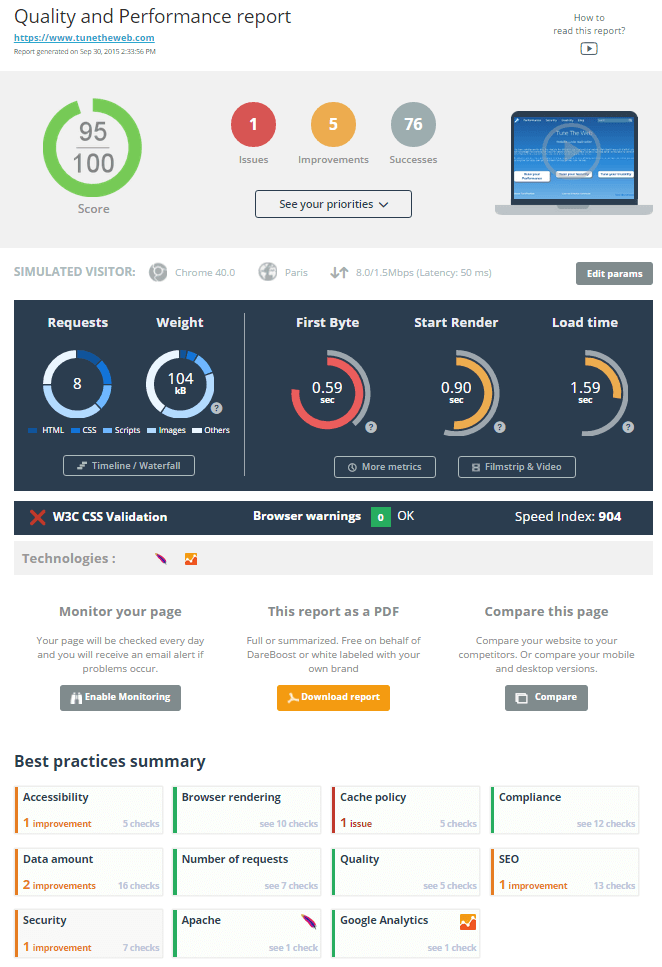
DareBoost
DareBoost is another tool, which in addition to checking your performance, also checks the validity of your HTML and CSS
Other tools
SpeedCurve is a paid for service where you can regularly run webpagetest style checks, and easily see a history to do trend analysis or keep an eye on how you are doing against the competition. This can be very handy to keep an eye on web performance over a longer period of time for a small cost. You can do this for free by running above tools periodically, but that does take a lot of discipline and even then some analysis to check these out.
If you are using Google Analytics then under Behavior there is a Site-Speed section allowing you to monitor your site speed, compare pages to the average and also see PageSpeed Insight suggestions. The good thing about this is it's based on real user metrics (i.e. the load times that your website visitors are experiencing) rather than some hypothetical speed estimate based on some measuring tool based in a high speed data centre. You can also use all the options of Google Analytics to drill down, or segment the data as you see fit. You can also do longer term trend analysis here - though unlike SpeedCurve you don't have the drill down available to see the reason why a page has slowed down.
In browser tools
Most browsers now have very good tools for performance monitoring or investigation, and as these are part of the browser you know they are using a version under your control (usually the latest for most browsers as they auto update - except Internet Explorer). Chrome Developer tools for example, shows waterfalls (and even screenshots now):
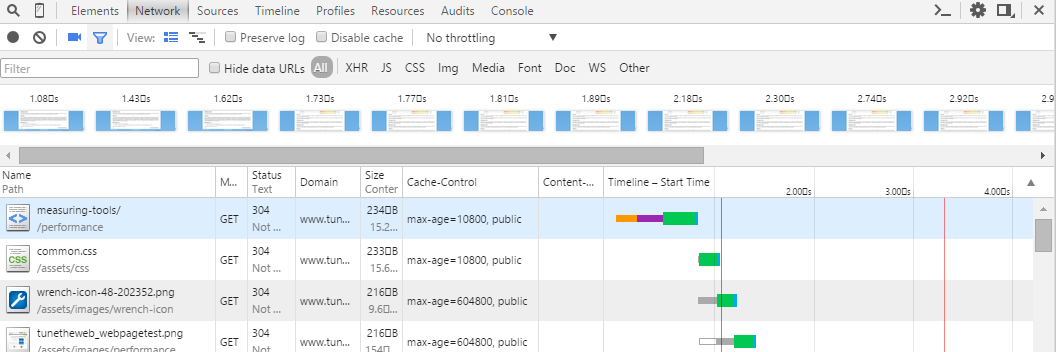
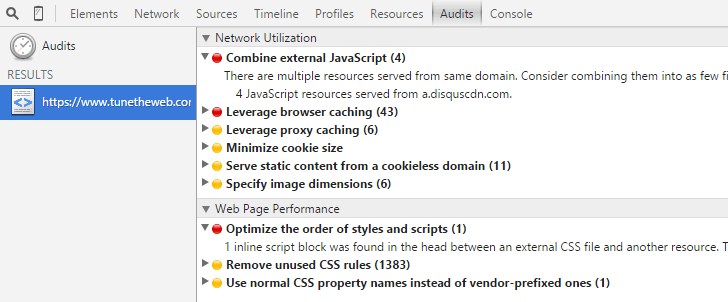
You can throttle the connection, to simulate how your page would load over mobile. Additionally, under the Audit tab, you can run performance tests, which gives various suggestions on improving performance for the page you are on:
You can also get various plug-ins for your browser to monitor performance of which YSlow is probably the best known. Perfmap is a nice little Chrome extension that highlights sections of your website to show how long they take to load.
Standalone tools
There are various offline tools to performance test a website. These are useful to set up automated testing or to do load testing to see what the capacity of your website is. Most of these are commercial applications that are not free. I would recommend starting with above tools first.
Summary
There are a wealth of tools available on the web to test your website and get performance suggestions. Most of these are free and require nothing more than just typing your website address and hitting Go. While these are very good, and you should look to run them periodically, do remember that they are generic by nature. No one will know your website better than you. Some suggestions (e.g. in-lining CSS, using sprites...etc) have downsides that may mean they are not appropriate for your site. However as long as you are aware of these, understand why the tools are suggesting those, and whether or not that is appropriate for your site, then that is the main thing that matters. Use this site or Google each improvement suggestions they make to understand them and decide if they are right for you.
More Resources
- Moz guide to understanding waterfall diagrams.
- Designing for Performance - Lara Hogan's book explains many of the concepts these tools will flag and is available online for free.
- TuneTheWeb Performance Resources.
This page was originally created on and last edited on .
Tweet