Helping to create the Web Almanac
This page was originally created on and last edited on .

Copy of one of my posts from another site
This article originally appeared in the 2019 Web Performance Calendar and is reproduced here with permission.
Introduction
In November 2019, the Web Almanac by HTTP Archive was launched at Chrome Dev Summit. This online report reviews the state of the web across 20 chapters split into four sections. The project was the brainchild of, and led by, Rick Viscomi, one of the HTTP Archive's core maintainers. It ran from January 2019 and continues to be developed.
The report aims to utilise the HTTP Archive dataset. This is made up of crawls of nearly six million website home pages. In addition to the raw data from those crawls, it uses various other tools including WebPageTest, Lighthouse, and Wappalyzer. The URLs are fed from the Chrome User Experience Report (CrUX) which is powered by anonymous usage from Chrome users and that provides a further source of data for Authors to use (for example, the Performance chapter made heavy use of the CrUX data so is not limited to just home pages. You can read more about the methodology on the project's website.
The Web Almanac looks across a wide range of topics, that we decided were important measures of the state of the web. Therefore, it is not just limited to Web Performance like this series of posts typically concentrates on. However, a number of chapters touch on performance or performance-related topics:
- The Performance chapter, obviously.
- The Media chapter, goes through the usage of images and videos on the web, which are usually the largest resources of a site.
- The JavaScript chapter looks at what is often the largest bottleneck in performance since "JavaScript [is] always the most expensive part of your site."
- The Third Parties chapter goes through a key part of your website that you often have least control over.
- The PWA chapter discusses a key technology in producing app-like websites.
- The Mobile Web chapter delves into how we are failing what is increasingly becoming the primary method for web consumption.
- The Compression chapter investigates text compression - an easy win for web performance but one that far too many sites are still not doing properly.
- The Caching chapter has a deep dive on how caching is used (or not) on websites, which again is a key part of web performance.
- The CDN chapter investigates the use of CDNs which are often used for scale and performance reasons.
- The Page Weight chapter looks at the ever-increasing size of web pages and the impact of that.
- The Resource Hints chapter goes through the use of resource hints (
dns-prefetch,preconnect,preload) and related technologies that can help speed up the loading time of websites. - The HTTP/2 chapter, written by this author, looks at the use of the relatively new technology which was specifically designed to improve the performance of the web.
Therefore, at least 12 of the 20 chapters are directly to do with web performance, and many of the others have parts related to web performance. Additionally many familiar names from the web performance community contributed to the project. I'd advise anyone involved in the web, but particularly those interested in web performance to check it out, if you have not already.
This post is not looking to summarise the report - the chapters say more than I could on the subjects (except for one - since I wrote it). Instead, what this post aims to cover is a bit of a look behind how it was built, particularly from my own point of view and experience. From there I want to talk about how you can get involved in the project now, or for future years, as we hope to make it an annual publication.
How I got involved and what I got out of it
I first heard about the Web Almanac on Twitter, and offered to help out on the HTTP/2 chapter, having just recently published a book on the subject. I took on the Author role for this chapter, suggested some metrics that would be good to investigate, and then hung back while Rick and the others designed and created the website from scratch, queried the data for us authors to interpret, and generally did all the hard work.
After getting hold of the requested stats for my chapter, I delved into the data more and set myself up with access to HTTP Archive so I could look into some of the anomalies myself. I'd heard of this dataset, and know many in the web performance community (and other web communities) make heavy use of it but had never made the time to look at it in detail. Delving into it I can see how addictive and costly!) it can be and becoming familiar with that was the first big benefit of this project to me.
As I wrote my chapter, I saw the project had even more potential than I initially thought and got more heavily involved. The publication date approached rapidly, and with such a big, disparate team, timelines inevitably started slipping. I was happy to help to try to keep it somewhat on track.
After finishing my own chapter, I got involved in the copyediting, which basically involved reading the chapters for typos and trying to bring some consistency between the different chapters. I'm far from a language expert (my old English teachers would attest to that!) but writing a book had given me some insight to that, and once I had a process for common things to look for this became easier. Rick even won me round to the Oxford comma, which I'd detested for so long.
After that I also got involved in some of the web development. I manage a software team by day, so am always itching to get back to actual coding and this project allowed me to flex some of my development muscles. I'm far from a competent JavaScript developer (I'm one of those weirdos who like websites to be built on HTML and CSS, and only enhanced with JavaScript), and I also had never used Python or it's Jinja templating engine. Despite this, I was quickly able to make small tweaks and submit them for review. Having the rest of the team code reviewing my pull requests, helped improve my code enormously, and gave me confidence that I wouldn't be able to break things too badly!
One thing I also find particularly satisfying with working on open source projects is the ability to fix things that annoy you. I had two niche issues related to data visualisations we used in the chapters.
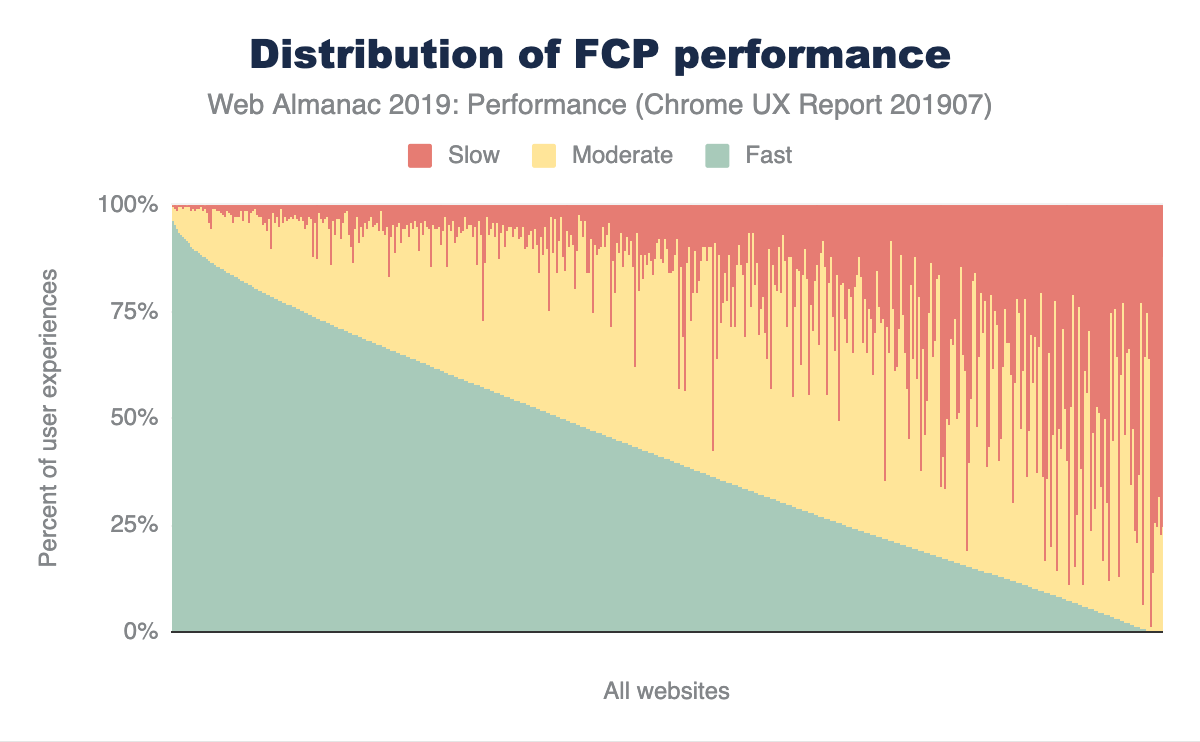
The above is just a PNG image but in the Almanac itself they are interactive visualisations created in Google Sheets. Unfortunately these do not show on iOS due to limited canvas support, and while we reverted to images on mobile for performance reasons, my iPad was still unable to show them. Additionally, my employer blocks Google Sheets access for data loss prevention reasons, so I couldn't see any images there either and just a "this iframe could not be loaded" error. I was in the minority for these issues, so they weren't a huge priority for the project to fix, but they bugged me irrationally nonetheless. So I fixed them! Google Analytics has since shown 3.02% of visitors were affected by the first issue, and 2.17% by the second, and those numbers are likely inflated by myself being so heavily involved in the project, so it was the right call not to concentrate on them, but it was also the right call for me to fix it since they affected me personally.
I'm a bit obsessive by nature, once I get into something, and that led me to becoming one of the top contributors to the project and spending what was probably an unhealthy amount of time on the project but I found it a rather enjoyable side project. The contributors, including myself, also got a mention during the Chrome Dev Summit keynote, which was pretty satisfying.
Leading by example
One of the big things we wanted out of this project was to practice what we preached. One of the risks of doing a review of the web, pointing out all the bad practices websites are doing, is it leaves you open to criticism if your own website does the same! I've been guilty of this myself, complaining about the AMP project (a project apparently all about speed) having a poorly performing website.
We wanted the Almanac website to follow best practices and had access to all the experts involved in the project to ensure that happened. Auditing and improving performance was a given, considering some of the people involved in the project and we continually identified and improved the website. Finding that one of the images in the Page Weight chapter was 38 times the size it needed to be, was one fix swallowed with a heavy dose of irony.
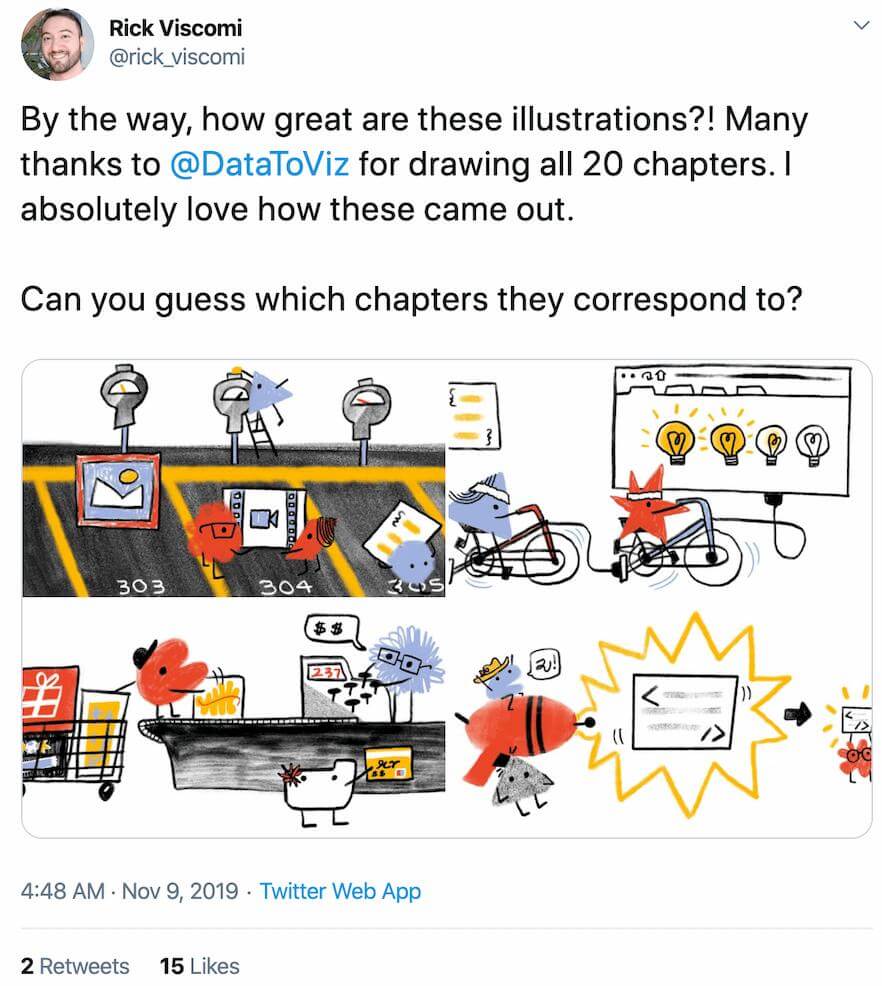
We also looked at ensuring optimal SEO, as is recommended for any website these days, but particularly when we felt this project could be such an authoritative resource on these topics. The project also had some stunning graphics commissioned (hat tip to Susie Lu on those visuals btw!):
We worked to ensure these graphics would automatically show for social media shares, which proved particularly worthwhile given the prevalence of the project on Twitter and the like post-launch.
Addressing any accessibility issues was especially important to us given that we wanted this project, and the findings from it, to be open and available to all. I'm very pleased (and more than a bit proud of the part I had to play) that the reports should be accessible to all, with well-written, semantic HTML that works even when JavaScript is disabled, detailed alt attributes as well as aria-labels and aria-descriptions of all the images. Saying that, if you spot a problem with the accessibility of the site then please do raise it.
On a similar note, we intend to make the data in the reports as widely available as possible. First up, we are actively working on translating the chapters and are making good progress on Japanese, Spanish, Portuguese, French and Arabic versions. The site was developed from the start with multilingual support, so we're pretty much good to go as soon as these are translated. We hope to launch these languages (and hopefully more) in early 2020. We would love to hear from anyone else willing to get involved in translating the chapters to help as many people as possible to be able to avail of this information.
In terms of the data behind the reports, the SQL used to query the HTTP Archive is freely available and we have dedicated discussion forums for those that want to ask any questions on the chapters. Some of these have helped surface errors (hey, we're only human) and we'll correct these as we become aware of them. Again going with the ethos of the project we want to be as open and transparent as to the source of the research and are happy to field challenges to the data and improve the quality of the chapters. We also feel giving access to the queries will open up the HTTP Archive to new users and that can only help the web community discover new insights from this rich data set.
At the time of writing, I can't say we've solved all the issues with the site, but I'm pretty proud of what we've created and think we’ve succeeded in practicing what we preach.
How you can get involved
The aim of this post isn't about boasting about what we have achieved here (well at least it's not all about that!) but it is intended as an open invitation to the wider community to get involved. There's still work going on to improve the 2019 website and we'd love to have more people join us on GitHub and help contribute. Hopefully this post gives a little flavour of what's involved.
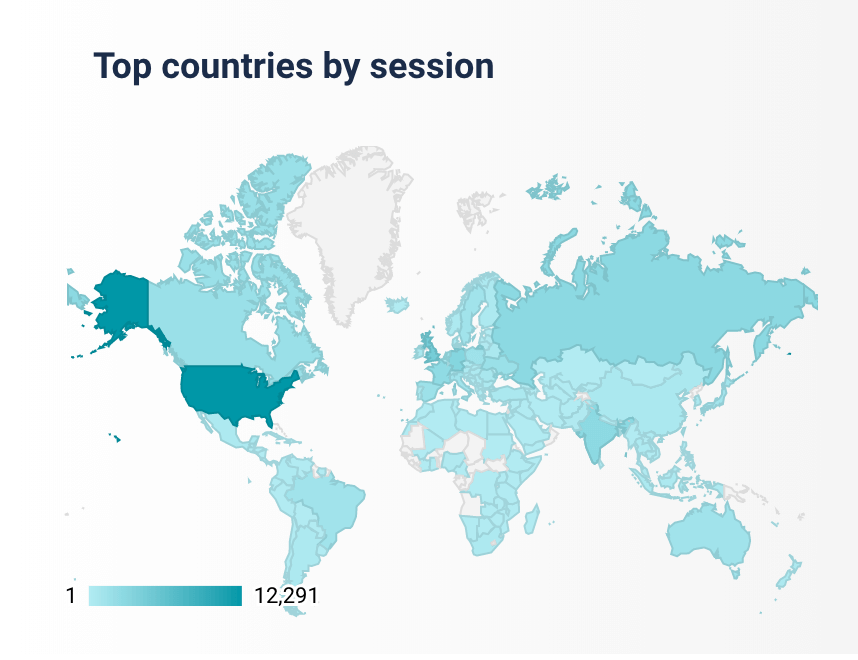
I want to particularly emphasize this invite to those NOT working for the big tech companies. This isn't meant as a slight against Google, Facebook, Twitter or any if the big CDNs like Cloudflare or Akamai, as I think they do a huge amount for the web community and the Web Almanac would not exist without them. But I'd like to call out to the smaller developer who doesn't think they can get involved because they don't work for one of them. I'll let you into a secret - I don't. And one of the big reasons I wanted to write this post rather than Rick, or any of the other experts who have a far greater visibility and following than me, is because I don't want them intimidating you! We'd love to hear from junior developers, people new to this space, and people looking to take a step up in the web performance community (or the SEO community, or JavaScript, or whatever!). It's also an opportunity for people who've never worked on a project with this reach before - and it has had a huge reach already (130,000 page views in 3 weeks since launch!), and is being read the world over:
As I say, we haven't finished with the website yet, and we may never actually complete it since we have an ever growing list of issues and ideas to make it better. We're looking to make it available as a single eBook to download, perhaps a PWA so it's available offline, and many more things. So there's plenty still to do for those wanting to get involved. We've also started thinking about next year and have an interest form for those looking to get involved in the 2020 Web Almanac. Now we do want the authors to carry a certain amount of weight in what they say, so are looking for experts in those fields (except for the HTTP/2 chapter where they got desperate), but I for one would love to get a greater variety of people involved in this next year, so do fill out the form if you'd like to get involved in any way.
So if this post has sparked your interest and you have questions, then please comment below, I'm always available on Twitter, or better yet pop over to GitHub and start looking at the issues! We look forward to helping you get your first issue resolved.
Thanks to those behind-the-scenes people.
Finally I'd like to end this post by thanking the people behind the scenes who made the Web Almanac happen. The authors and reviewers (and hopefully soon the translators) get quite a bit of visibility at the top and bottom of each chapter, but the Data Analysts, Web Developers, Designers and Editors are the people behind the scenes who did so much of the work. From my own viewpoint, I'd like to thank a few people, and especially Rick Viscomi who put more effort in than the rest of us combined - I'm really hoping I don't look like I'm trying to steal his thunder with this post. A well-deserved shout out also goes to Mike Geyser, Yvo Schapp, Catalin Rosu, and Aymen Loukil for doing so much on the website, and finally David Fox, Rachel Costello and Paul Calvano did a huge amount of the painful editing and visualisations, that made the end product seem so professional. Thanks to those people and everyone else who I got to work with on this - it was, and continues to be, an absolute pleasure.
Let me know below your thoughts below, or a the original Web Performance Calendar article.
This page was originally created on and last edited on .
Tweet